Tables and graphs of summary data
The Dashboard is an option on a tab at the foot of the Management Summary. It shows selected data for a run as a set of tables and graphs.
● Move to the Management Summary
● Select the 'Dashboard' tab
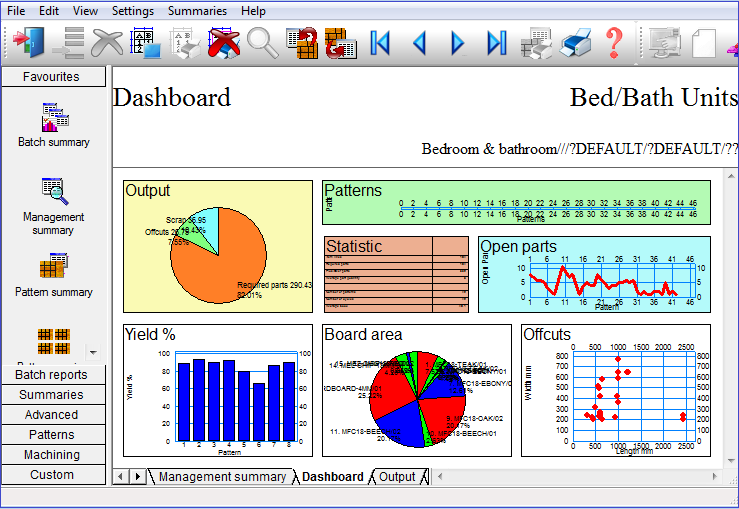
The top line shows data from the Management summary. The bottom line can include up to 3 charts from other summaries, for example, the Cycle time from the Pattern summary.
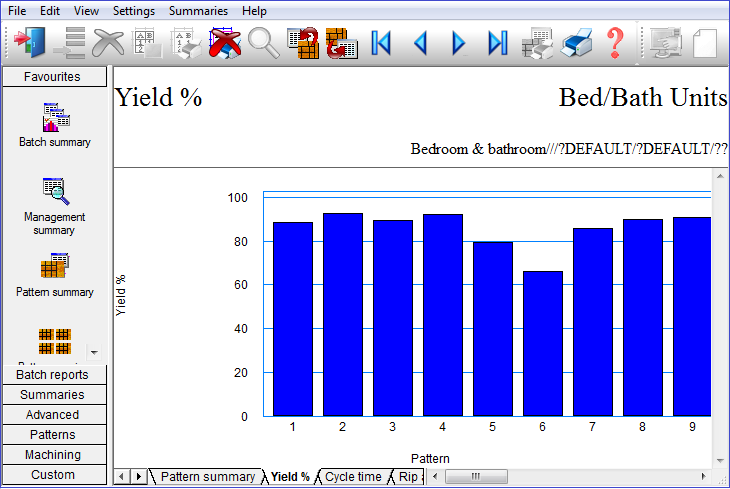
- Click on a summary to see the details full screen.
The information shown on the top row of charts from the Management summary are:-
Chart 1 - Required parts, Plus/Over parts, Offcuts, Scrap and Core trim.
Chart 2 - Patterns origins e.g. from Full sheets or Offcuts
Chart 3 - Statistics for the run
Chart 4 - Open parts in each pattern
How to create a Chart for the Dashboard
The top 4 items in the Dashboard are fixed and cannot be changed. These show basic information about the run. These are:-
Output
Patterns
Statistic
Open parts
The other 3 charts are user defined. The charts are all charts defined for other summaries, for example, the offcut summary or the board summary.
If the required chart does not exist move to the relevant summary and use 'Settings - Chart settings' to create the chart.
Once the chart is created it can be selected at the Management summary for the Dashboard by choosing the option:-
- Select: Settings - Chart settings
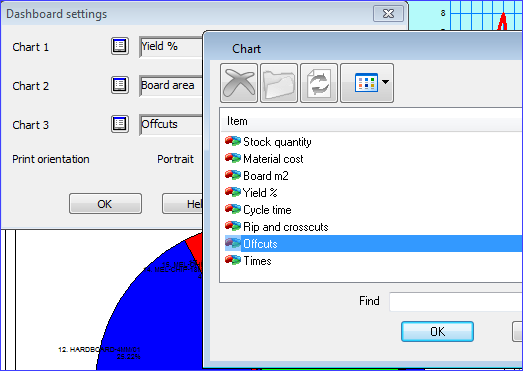
 Use
the List box to select from existing charts
Use
the List box to select from existing charts
![]()