
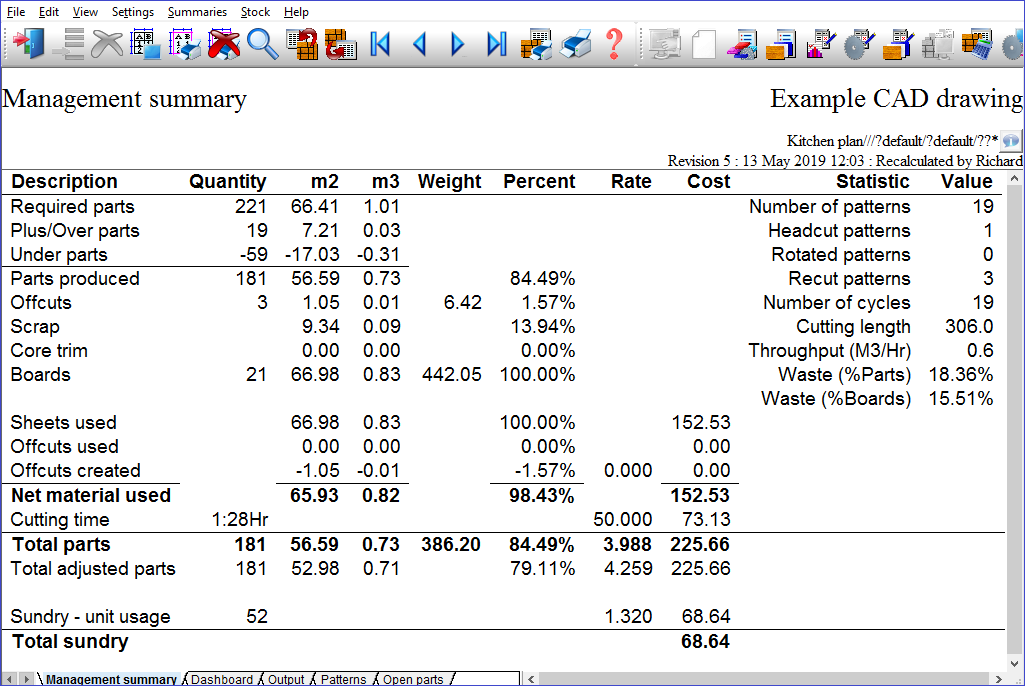
Summary of results showing overall yield and costs
At the Review runs screen:-
● Select: Summaries - Management summary
or
![]() Select the Toolbar option
Select the Toolbar option
Use the Navigation buttons, Summaries menu or Stacked toolbar to browse the summaries. Many Review Runs options are also available on the top Toolbar
 adjust
on-screen column and row width
adjust
on-screen column and row width
![]() zoom display in / out
zoom display in / out
![]() print current report
print current report
![]() exit
exit
For full details of the on-screen options see help topic: Review runs screen
Dashboard - the tab at the foot of the screen shows the Dashboard - which is a selection of analysis of the run data as a set of tables and graphs. For details of how to customise the charts on the Dashboard; see the help topic: Dashboard
As well as the default fields shown the report can be modified by removing or adding extra fields; see: Settings - Report settings.
Notes
Material usage - This shows how the material was used for producing the parts required; showing both the parts produced and the waste. Material use is shown as area, volume and percent. The percentage is based on comparing the areas of material (M2 or Ft2) and not on volume. For a mixed material list the waste as a percentage of volume will be different from the waste as a percentage of area.
Area of material - This is the area of material used. If you are working in millimetres the area is shown in square metres (M2). If you are working in inches the area is shown as square feet (Ft2). On the offcut summary this is the area of 1 offcut
Volume of material - This is the volume of material used. If you are working in millimetres the volume is shown as cubic metres (M3). If you are working in inches the volume is shown as cubic feet (Ft3).
Quantity of material - This is the quantity of material used. That is, the number parts, number of boards etc. Scrap and core trim do not have associated quantities
Percent of material used - This is the material usage expressed as a percentage. The percentages are based on the area of the material not on the volume.
Required parts - On the Management summary - this line shows the material used in producing the parts required. The parts required are the parts shown in the Quantity column of the part list. This value does not include any over or under production.
On the Batch summary - this column shows the total area of parts produced (including any over or under production) in square metres (or square feet). You can choose volume measures as an alternative by changing a system parameter setting.
Parts over - summaries - This line shows the material used in the over production of parts. Over production will not exceed the limits for over-production that you set in the part list. If you set the overproduction to 0% then no overs are produced.
Under parts - This line shows the material not used because of the under production of parts. A part is under produced when the quantity produced is less than the quantity required.
Scrap - this line shows the amount of material that is waste or scrap expressed as AREA, VOLUME, and a PERCENTAGE. The percentage value shown is the waste expressed as a percentage of the total volume of boards; this value is also shown at the far right of the Management summary. It is one of the most common measures of performance as it shows the overall efficiency of material conversion. Many companies also use the opposite of this figure which is the YIELD. The yield is simply calculated as 100-waste (percent). For example if the waste is 8.61% then the yield is 100-8.61 = 91.39%
Boards - On the Management summary this line shows the total amount of board material used in area and volume measurements. The percentage figure shown is always 100% because this represents the total volume of boards used and is included to remind you that the percentages shown above are calculated as a percentage of the total volume of boards used. On the Batch summary - you see the total amount of board area used for a run in square metres (square feet). You can choose Volume measurements as an alternative to area.
Number of parts - This is the total number of parts produced. The value includes any under and over production. Take care - you cannot use this quantity as a measure of performance because, of course, the parts are usually of many different sizes
Number of boards - This is the total number of boards used. If the job uses different board sizes then the number of boards should be used with caution as there is no indication of which size boards were used. You need to check on the Board summary for this extra information
Number of patterns - This is the number of different patterns used in the job. Note that each pattern may be used more than once, this is shown by the run quantity against each pattern in the pattern summary. The value shown here indicates the number of pattern setup changes you have to make at the saw.
Number of cycles - This is the number of cycles of the saw needed to produce the parts. The number of cycles is a guide to the overall cutting time. For example, cutting repeated patters more than 1 high can significantly reduce the number of cycles and hence the overall cutting time.
Waste (%parts) - This is the area of waste or scrap expressed as a percentage of the area of parts produced. That is-
Waste (%parts) = (area of waste/area of parts produced)*100
Note that the values on the summaries are rounded to the nearest value to two decimal places.
9.42% = (5.38/57.13)*100
This percentage is often used as a way of expressing the amount of material wasted for each part produced or for expressing the wastage in terms of the customer value. The value for parts produced includes any overproduction.
Waste (%boards) - This is the amount of waste given as a percentage of the total area of board material used. This is the most common way of expressing the waste. The Yield is the opposite value, for example, 5% waste is a 95% yield. This waste is calculated as:-
Waste(% boards)= (area of waste/total area of boards)*100
For example:-
8.61% = (5.38/62.51)*100
Quantity - This column shows the quantity of material in area. If you are working in millimetres the area is shown in square metres (M2). If you are working in inches the area is shown square feet (Ft2).
Rate - The rate or cost ratio shows the cost of producing 1 square metre or 1 square foot of the required parts. The value is per square metre if you are working in millimetres and per square foot if you are working in inches. The value is calculated as:-
Cost of Material/Area of parts produced
The area of parts produced includes any overproduction.
Totals - This column shows the totals for various items. For example, total number of parts produced, total number of boards used and so on. The percentages at the bottom show the percentage waste in terms of the area of parts produced and in terms of the total area of boards used.
Total parts - This is the parts obtained by the optimisation expressed in terms of the area of material and the cost ratio or rate, and the total cost. This includes under and over production, if any.
Total cost - This column shows the total cost of the optimisation. That is the total material cost. This is the full cost of the material used.
Edging - This shows the amount of edging in linear measure (e.g.: feet or metres) of edging used. The one letter edging code is shown first and then the amount of edging. If the run has several different types of edging there may be several lines for the edging data. This value does not include any overlap or excess for each edge on the part so it is only an approximate guide to the edging required. If you are working in millimetres the edging is shown in metres. If you are working in inches the edging is shown in inches.
Material used - This line shows the total area of material used. If you are working in millimetres the area is shown in square metres (M2). If you are working in inches the area is shown in square feet (Ft2). This line also shows the total material cost.
Head cuts, recut patterns - This item shows the number of patterns with a head cut and the number of patterns with a re-cut. This gives you a rough guide to the overall cutting complexity and the nature of the patterns.
Offcuts - This line on the Management summary shows the number of offcuts produced and the area and volume of offcuts. The offcuts are not counted as part of the waste. You can define the use of offcuts and the minimum and maximum offcuts sizes with the Optimising Parameters.
Cutting length - On the Management summary the cutting length is the total linear cutting length (in metres or feet). This is the total length of all cuts in a pattern multiplied by the number of boards and you can use this value as an estimate of the life of a saw blade.
Note that the calculation is based on the number of boards and not on the number of cycles because the program assumes that the wear on the saw blade cutting , for example, 5 high is the same as for cutting 5 single sheets.
The cutting length for nested patterns is the length of all the routs used to divide all the parts up. It does not include any routs inside parts.
Throughput - On the management summary this figure is the volume through the machine per hour. The volume is measured in cubic metres (M3) or cubic feet.
For nested patterns it is calculated as follows: Total board volume / Time taken to divide out all the parts on all the patterns
Core trim - The Core Trim is the waste produced when a part is cut oversize and cut again, for example, on an edgebander prior to edging. The program calculates the area an volume of parts required based on the part size after the core trim has been taken. This means that where there is a core trim the part area shown is smaller than the area of the parts based on their cut size. Where there is no core trim (which may often be the case) the area and volume of parts represents the cut size.
The rest of the figures on the management summary such as waste and parts obtained and always calculated on the cut size of the parts regardless of whether any parts have a core trim or not.
Machine time - On the management summary this line shows the total machining time in hours and minutes and the cost rate per hour and the total cost of machining. The machine rate (for the saw) is set in the optimising parameters.
Sundry parts - if these are used the summary reports include columns or sections showing the details for the sundry parts.
Total adjusted parts - On this line the plus part area and volume included in the total part area and volume is reduced based on the "Value of plus parts" optimising parameter (see the Advanced page of the optimising parameters).
Plus part value = Low, area = 10%
Plus part value = Medium, area = 50%
Plus part value = High or Maximum, area = 98%
e.g.
Description Quantity m2 m3 Percent Rate Cost
Required parts 221 66.41 1.01 44.48%
Plus/Over parts 19 7.21 0.03 4.83%
Under parts -59 -17.03 -0.31 11.41%
Parts produced 181 56.59 0.73 84.49%
Offcuts 3 1.05 0.01 1.57%
Scrap 9.34 0.09 13.94%
Core trim 0.00 0.00 0.00%
Boards 21 66.98 0.83 100.00%
Sheets used 66.98 0.83 100.00% 152.53
Offcuts used 0.00 0.00 0.00% 0.00
Offcuts created -1.05 -0.01 -1.57% 0.000 0.00
Net material used 65.93 0.82 98.43% 152.53
Cutting time 1:28Hr 50.000 73.13
Total parts 181 56.59 0.73 84.49% 3.988 225.66
Total adjusted parts 181 52.98 0.71 79.11% 4.259 225.66
Plus part value = Medium
Total adjusted part area = Required part area + ((Plus/Over part area) * 50%) - (Under parts area)
=66.41 + (7.21 * 0.50) - 17.03 = 52.98
Notes:
i) The Rate value is the cost per unit area and is calculated by dividing the cost by the part area. The optimiser uses the cost per unit area when comparing and selecting patterns and solutions
ii) The Total adjusted parts line is only included in the Management summary for runs with Plus/Over parts
Boards and offcuts
Stock boards may consist of full size sheets and offcuts. The report shows sheets used and offcuts used.
Waste or Yield
The waste figure can be shown, alternatively, as a Yield (see Review runs - Global report settings).
Material weight fields - review runs and stock reports
Weight fields are available on the following reports.
Batch summary - Weight Parts field
Management summary - Weight field (Weight of offcuts, boards and parts)
Part summary - Weight field
Board summary - Weight field
Material summary - Weight Parts and Weight Boards fields
Offcut summary - Weight field
Saw loading summary - Weight field
Stock - Orders by material - Weight field
Stock valuation - Weight field
Monthly material report - Weight Parts and Weight Boards fields
The weight is kilograms or pounds depending on the current system parameter measurement mode. The weight field is located in the Available list in the report setting dialog.
If a material is specified that has no density set in the board library the weight = 0.
Weight is calculated as:
Area (board or part) x material thickness x quantity x material density